Persimmon Homes Deploys VUE’s HFR AI Technology to Enhance Site Safety
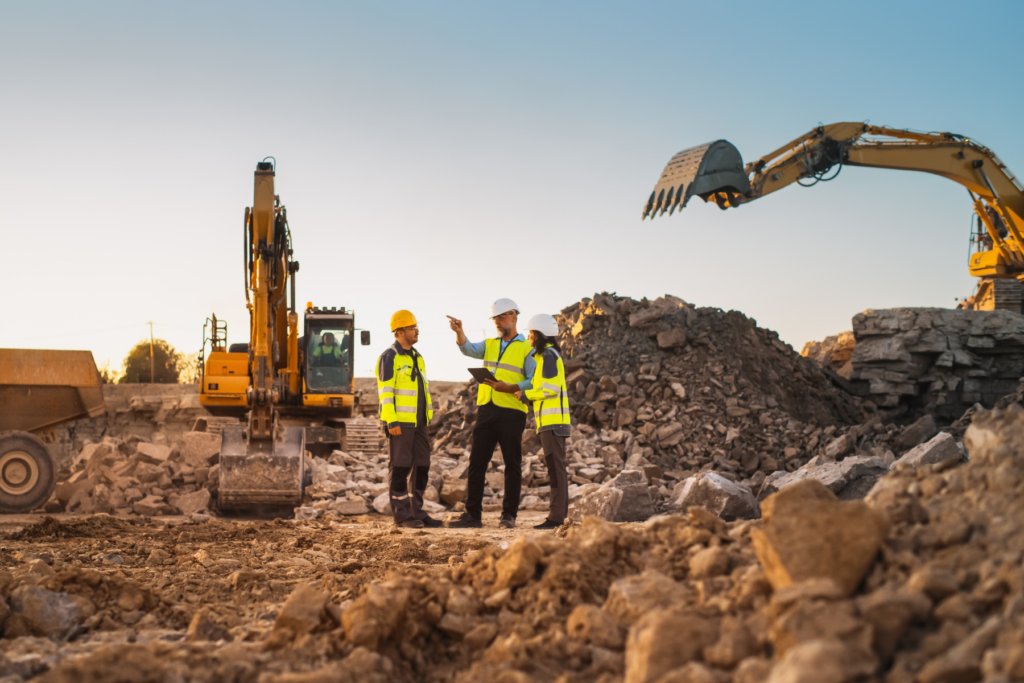
Persimmon Homes partners with VUE to deploy Human Form Recognition (HFR) AI camera kits across its national fleet of JCB and Manitou telehandlers.
Read More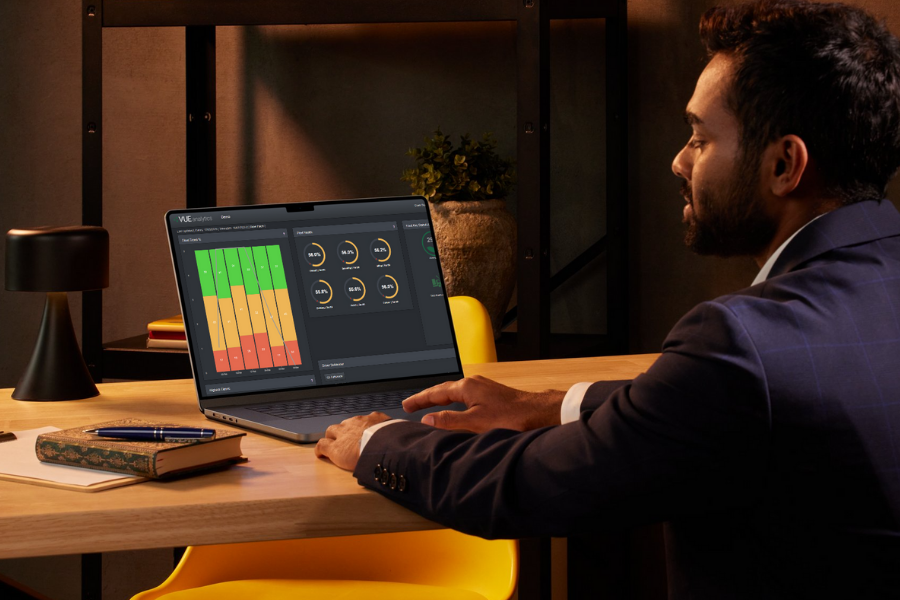
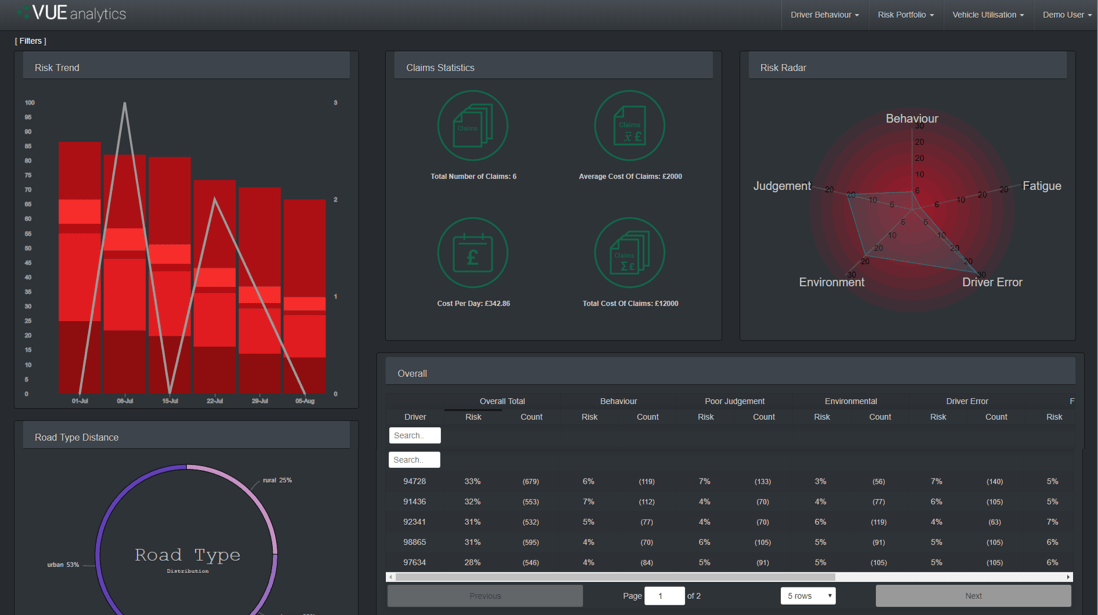
VUEhub provides you with a series of reporting dashboards that enable you to visualise fleet telematics data so you can instantly understand what decisions need to made to improve driver behaviour and vehicle utilisation. Unlike traditional telematics, you get contextualised information from your fleet such as the road type, road conditions, the weather, and more.
You can see fleet trends and hot spots, areas where more focus and action is required. Take control of your fleets risk profile and build stronger relationships with your insurer and risk partners.
Using data recorded from our own fleet telematics devices or from your own third-party telematics service provider, our dashboards run analysis using sophisticated risk algorithms to generate insight into how your fleet behaves, how vehicles are being used, where they are exposed to risk, and why. This can be measured against your industry benchmarks, using custom built KPIs.
Let our sophisticated algorithms do the hard work for you.
3rd party data such as road type and weather conditions provides unbelievably accurate insights.
By identifying trends within the data, you can see where your fleet is exposed to risk.
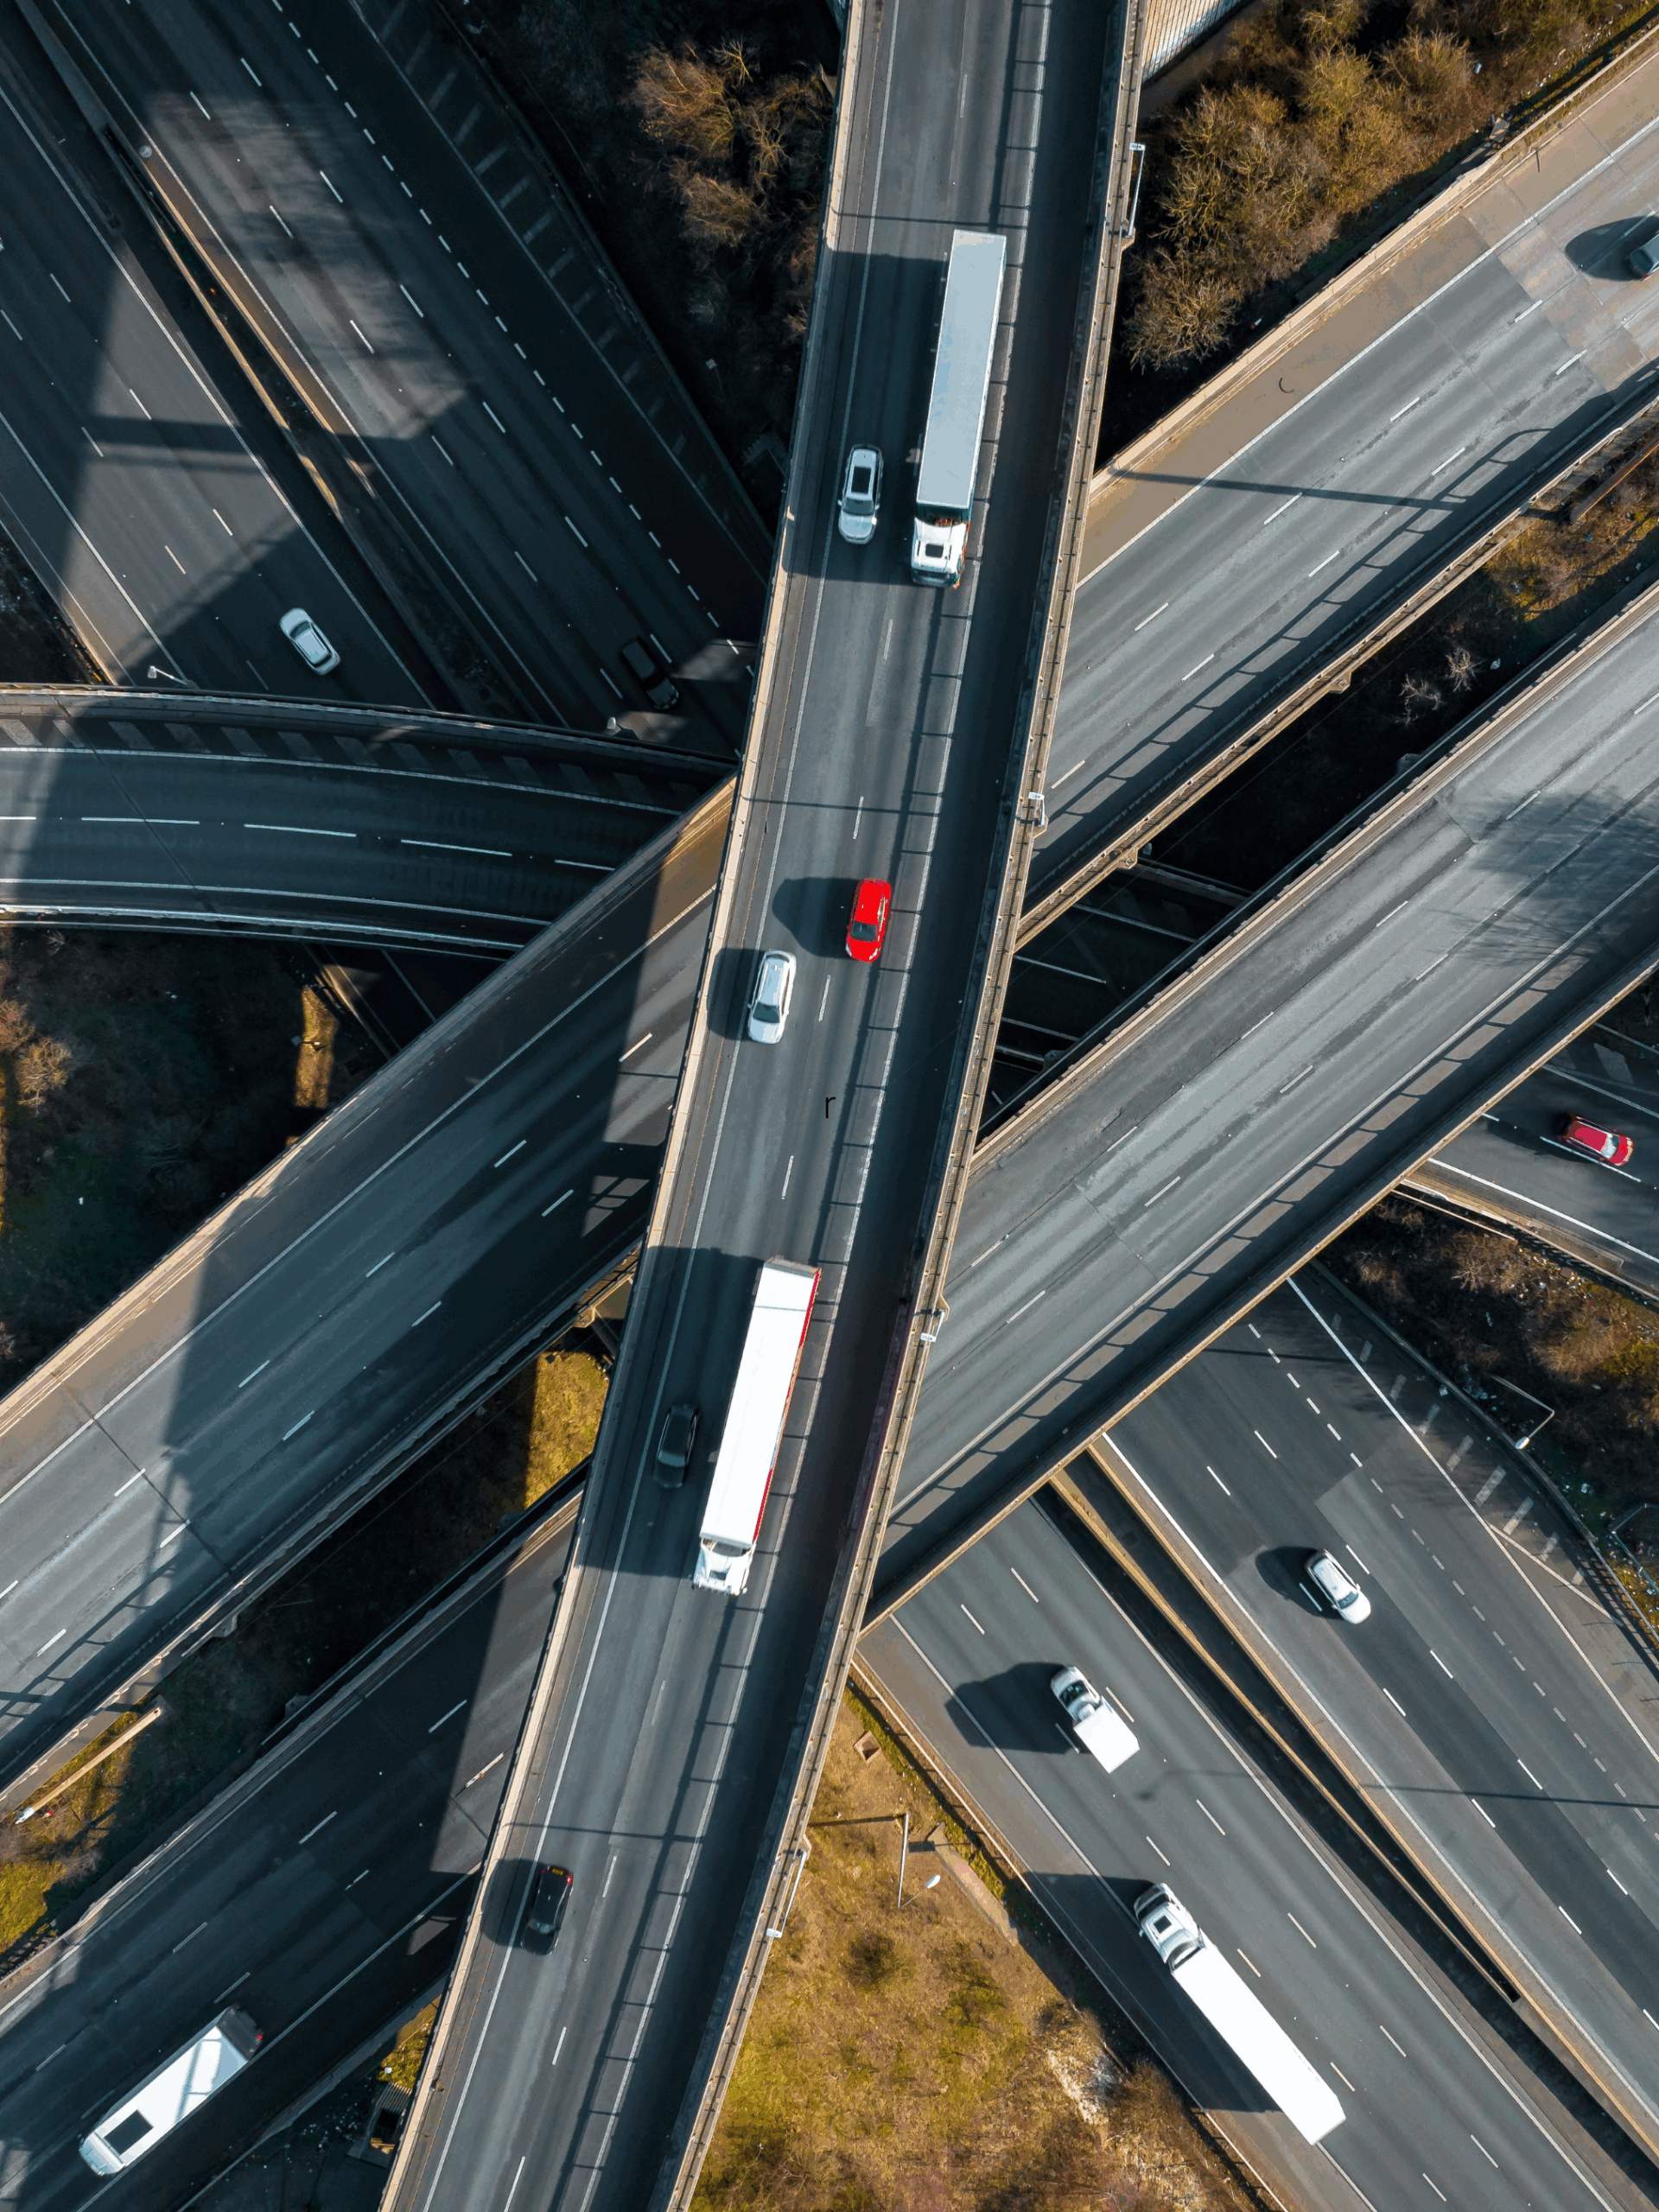
Persimmon Homes partners with VUE to deploy Human Form Recognition (HFR) AI camera kits across its national fleet of JCB and Manitou telehandlers.
Read More
Why your fleet needs a Data Protection Impact Assessment (DPIA), and how it improves your GDPR compliance.
Read More