
VUE Tackles theft in Transit with the Co-op
VUE has partnered with Co-op to tackle one of the most challenging and persistent security threats facing grocery logistics in the UK: organised theft in transit.
Read More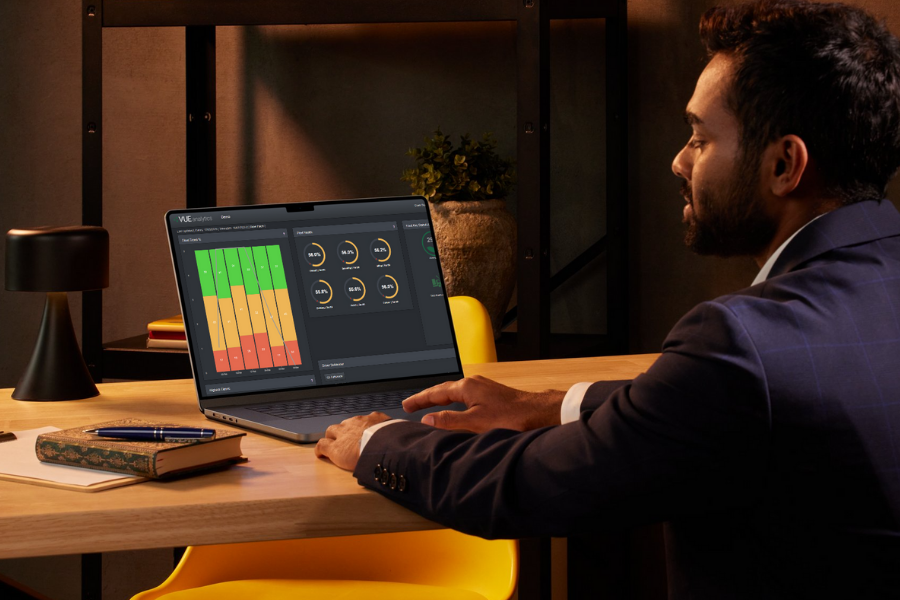
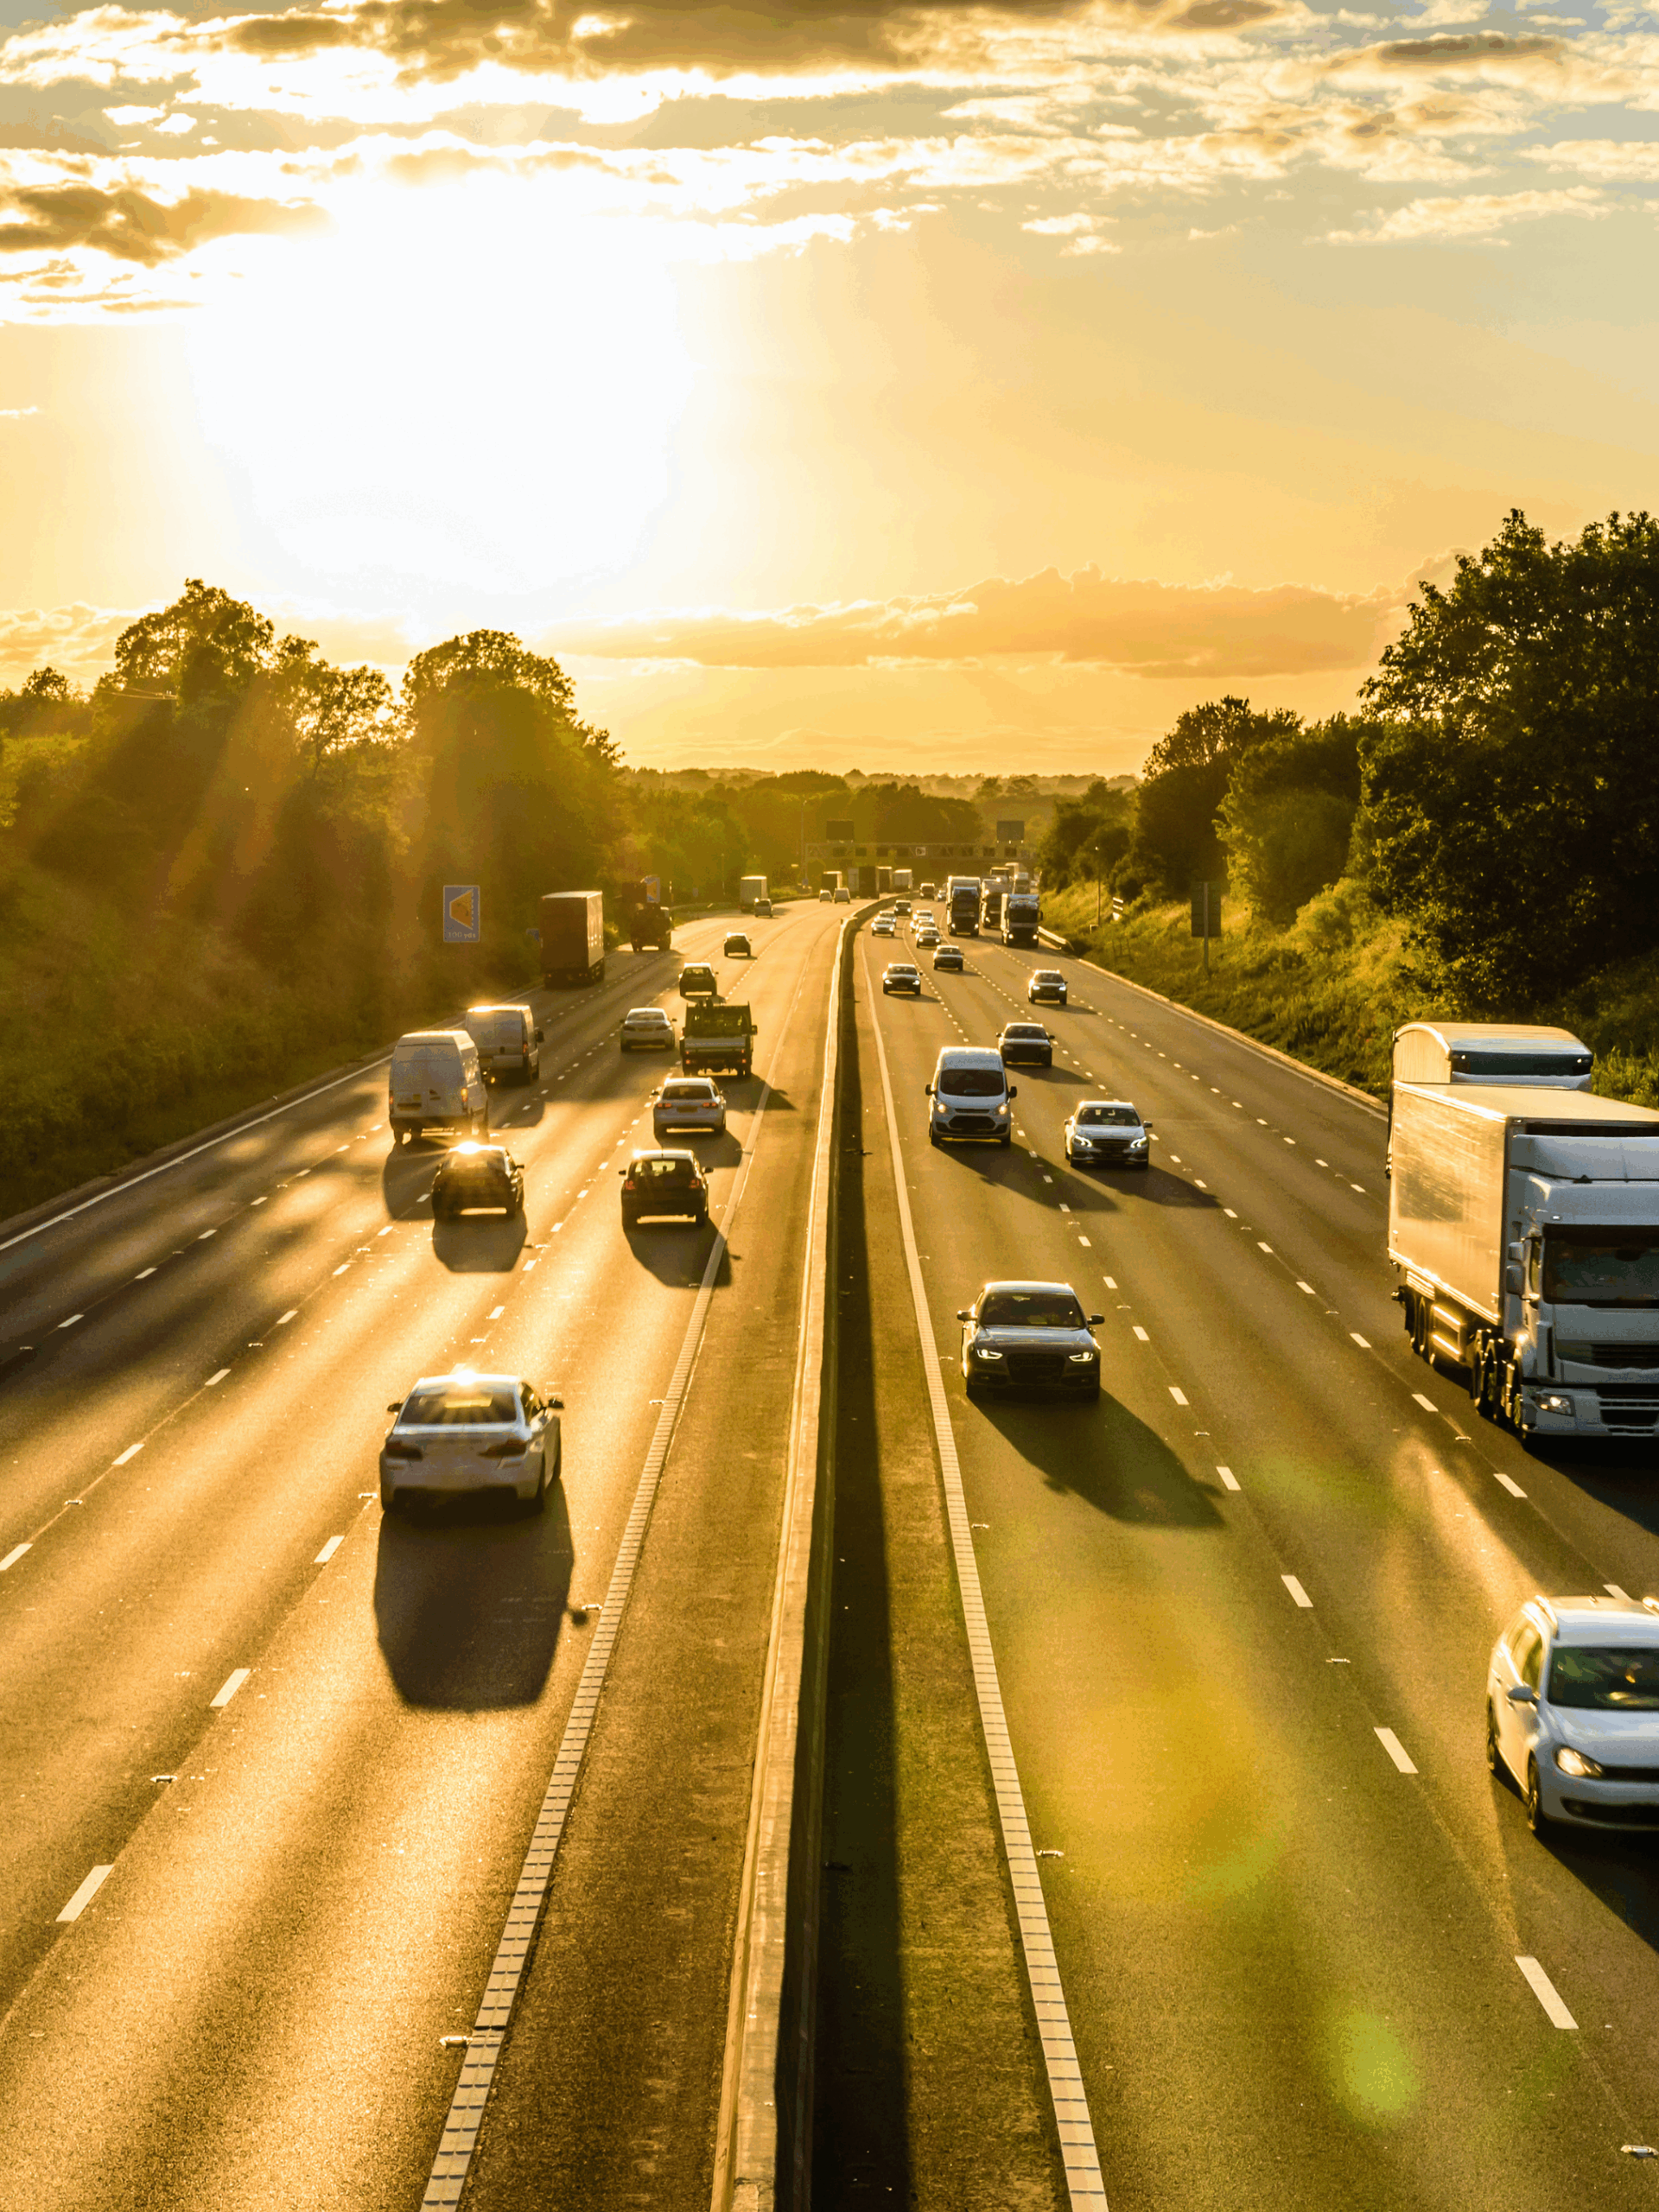
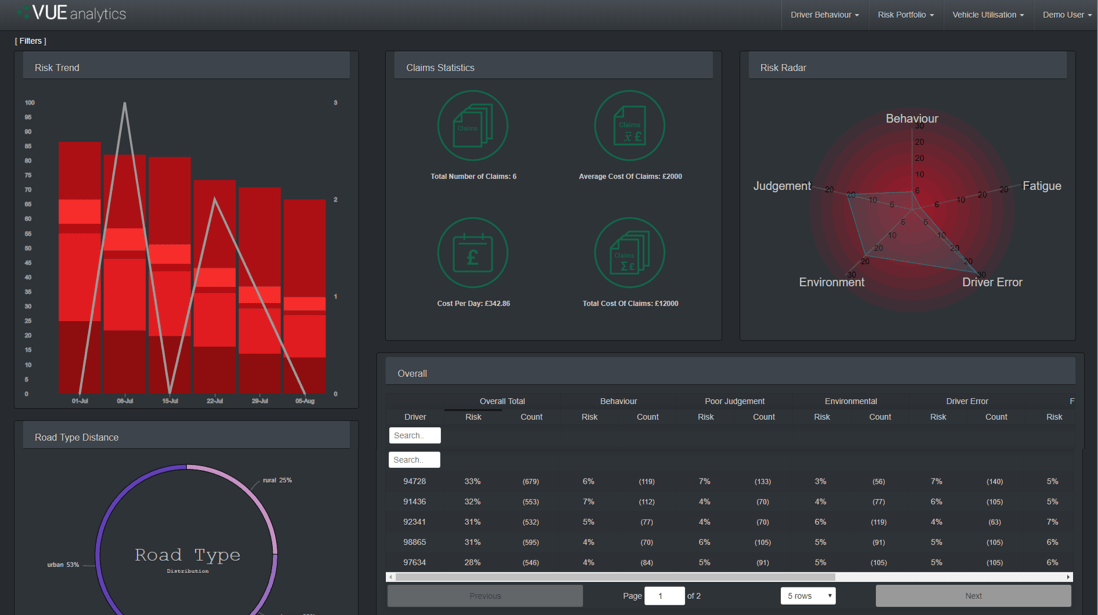
VUEhub provides you with a series of reporting dashboards that enable you to visualise fleet telematics data so you can instantly understand what decisions need to made to improve driver behaviour and vehicle utilisation. Unlike traditional telematics, you get contextualised information from your fleet such as the road type, road conditions, the weather, and more.
You can see fleet trends and hot spots, areas where more focus and action is required. Take control of your fleets risk profile and build stronger relationships with your insurer and risk partners.
Using data recorded from our own fleet telematics devices or from your own third-party telematics service provider, our dashboards run analysis using sophisticated risk algorithms to generate insight into how your fleet behaves, how vehicles are being used, where they are exposed to risk, and why. This can be measured against your industry benchmarks, using custom built KPIs.
Let our sophisticated algorithms do the hard work for you.
3rd party data such as road type and weather conditions provides unbelievably accurate insights.
By identifying trends within the data, you can see where your fleet is exposed to risk.

VUE has partnered with Co-op to tackle one of the most challenging and persistent security threats facing grocery logistics in the UK: organised theft in transit.
Read More
We’re proud to announce a major milestone for VUE: HFR Camera System has been officially approved for use across Balfour Beatty sites.
Read More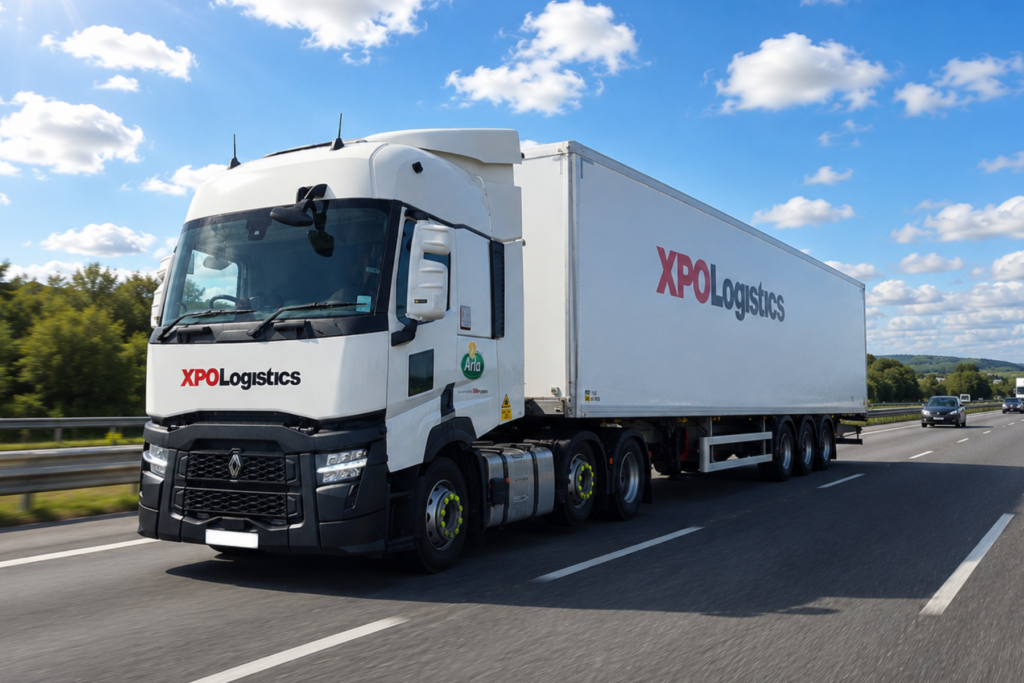
Discover how Managed Service across helped XPO Logistics eliminate camera fault backlogs, maximise fleet uptime, and successfully protect against fraudulent damage claims.
Read More