Fleet Management and Monitoring Solutions
Traditional telematics data which records information on speeding, harsh acceleration, harsh braking and harsh cornering gives you a basic picture of how well your fleet drivers are behaving.
Having further tools that add context and also interpret this data does make a big difference. Our suite of fleet management solutions enable you to monitor exactly how well your fleet is performing in relation to the environment, and identify areas for improvement.
For example, you’d like to lower accident frequency by improving driver behaviour. Looking at traditional telematics data will only show you how well your fleet is performing across the four areas mentioned above. However, add in data tools, like VUEanalytics, and you can put this information into context by seeing the types of roads they're travelling on, the road surface quality, and the weather conditions. This insight can completely change your understanding.
You can also add in past claims and accident data, to spot trends and more fully understand the types of accidents that are common across your fleet. Then you can do something about them.
Get in touch to find out more about fleet data & insights tools
VUE applications providing
fleet monitoring and insight
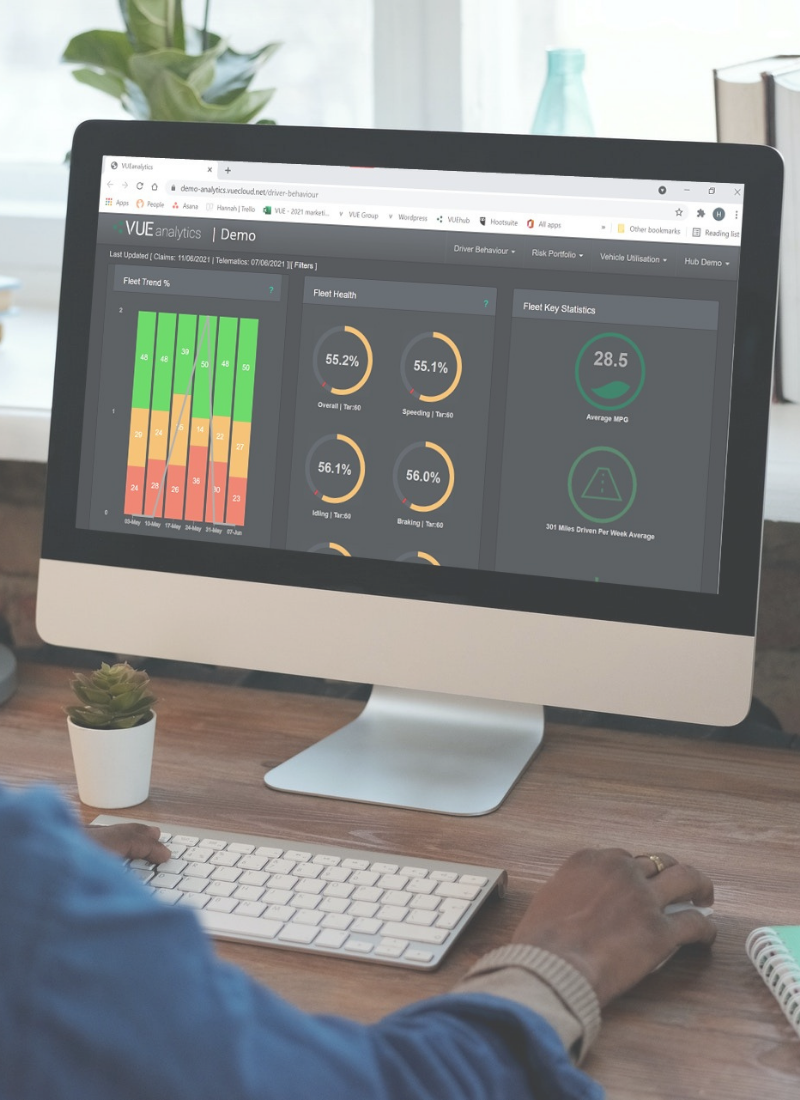
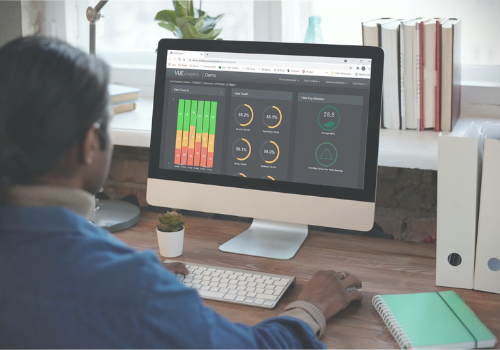
Driver Behaviour Dashboard
This analytics application enables monitoring of your overall fleet's performance as well as individual driver behaviour. It includes:
A fleet performance graph so you can easily see how well your fleet is performing over time. Its red/amber/green colour-coded design allows you to quickly identify areas for improvement
An overall fleet driving report, providing an average score for the entire fleet in terms of drivers' speeding, idling, braking, acceleration and cornering
Key fleet statistics including average miles per gallon (MPG), average miles driven per week, total number of claims and claim costs
Individual driver scores for their speeding, idling, harsh cornering and harsh acceleration, and the ability to easily manage your top and bottom drivers
A driver progress table which shows how your drivers have improved week-by-week, so you can monitor behaviour and progress
Using the Driver Behaviour Dashboard you can...
Quickly understand overall fleet driving standards and areas for improvement (eg. speeding) to implement tailored fleet management programmes
Identify fleet drivers to reward for great behaviour, and those that need improvement
Monitoring of fleet driver behaviour and weekly progress, so you can ensure drivers are on the right track
Measure the effectiveness of training and the impact on the overall fleet, individual drivers and claims or incidents
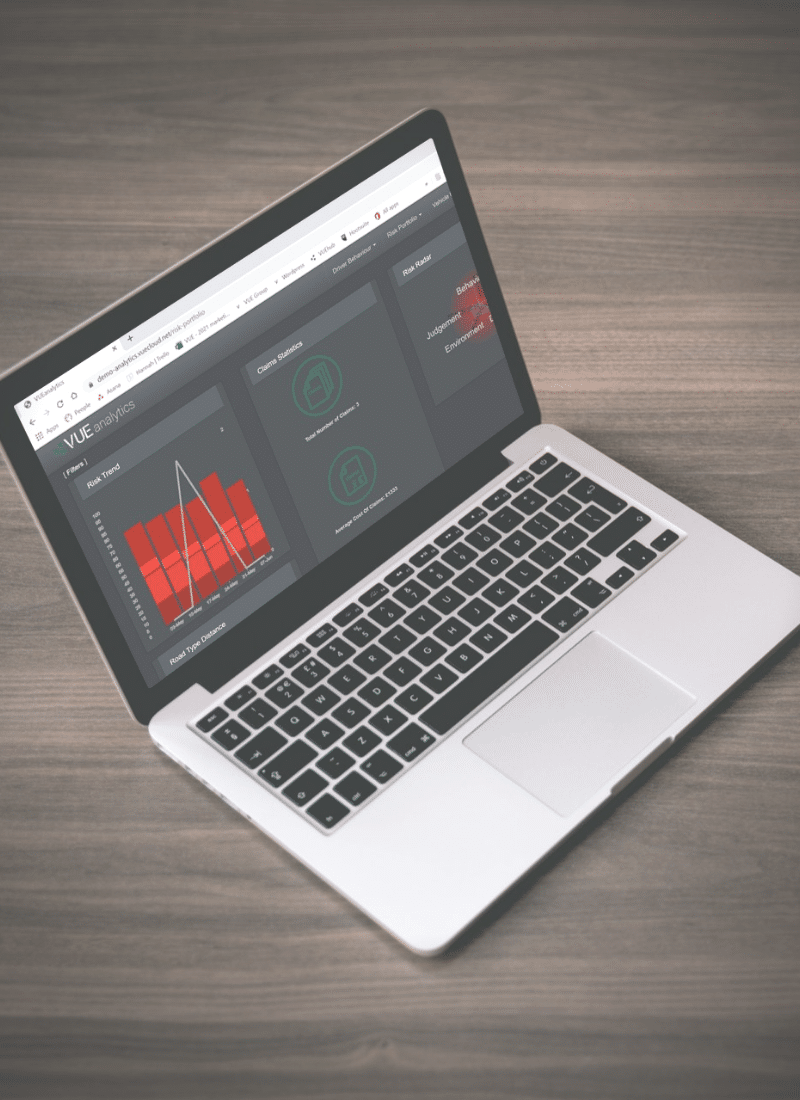
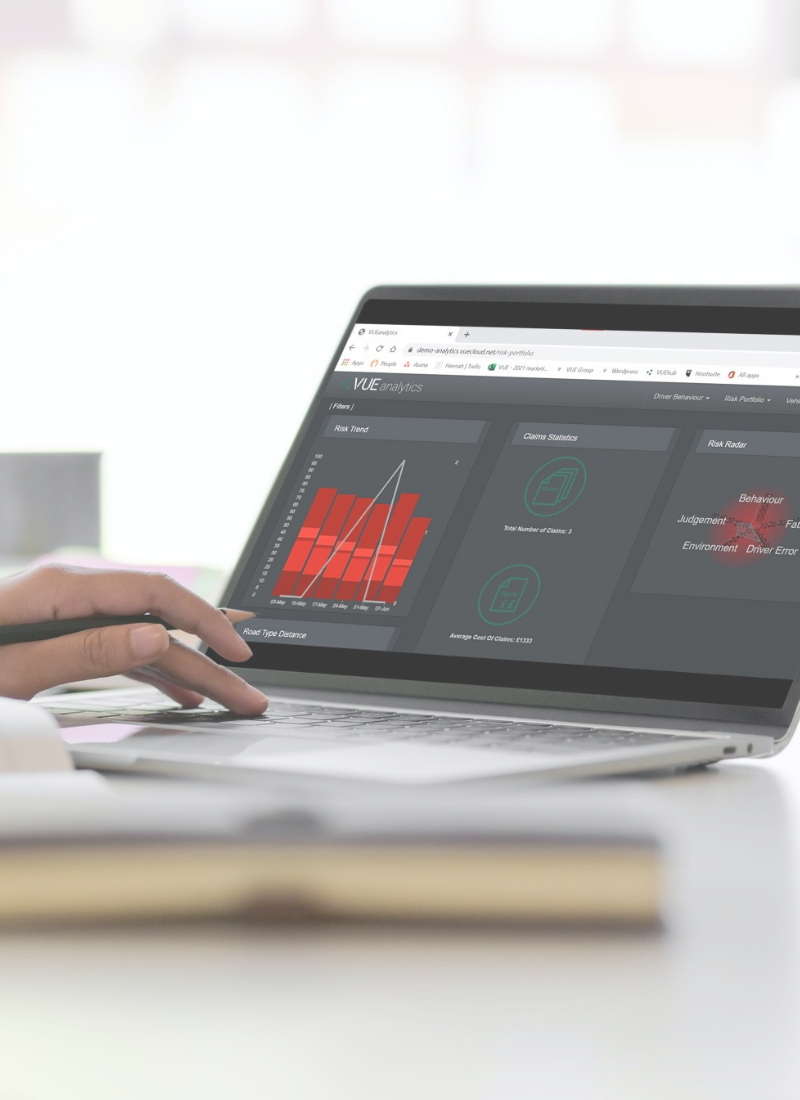
Fleet Risk Monitoring System
This reporting tool provides details of risks and trends so you can identify what is most likely to cause accidents and take action. The Risk Portfolio dashboard contains:
A fleet risk trends graph showing the weekly status of risks and the ability to see trends at a glance. Claims data from your insurer can also be viewed in this graph
Key claim statistics data as a feed from your insurer, so you have claims information in one place, including numbers of claims and average cost of claims
A risk radar which shows the areas of risk in most need of attention, including fatigue, environment and driver judgement
A breakdown of road types your fleet travel on including urban, rural and motorway
A cost of claims report showing the most expensive claims, the circumstances and liability
Monitoring of individual fleet drivers with information on their highest areas of risk, road type distribution, number of claims and average cost of claims
A detailed fleet driver management report - showing overall performance of drivers, where they have higher risk scores, and the ability to dive deeper into more detail and address them (eg. for driver error is there a trend of failing to look properly)
Using the Risk Portfolio you can...
Give context to telematics data by using environmental insights that give greater understanding
Identify areas of highest risk for your fleet drivers and your fleet; providing specific areas to target and minimise these risks
Understand relationships between driver behaviour and accident and claims history, with the ability to more fully investigate causes
Identify factors contributing to driver error so you can educate and manage your fleet on how to improve their behaviour
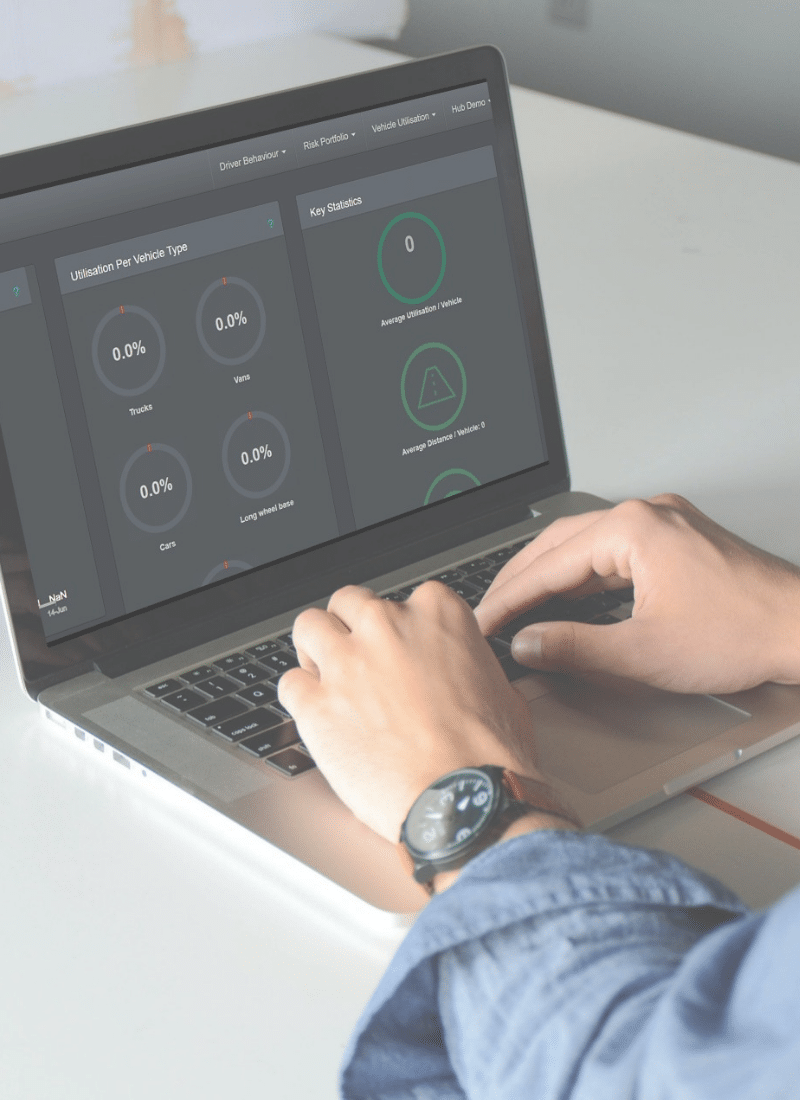
Fleet Vehicle Utilisation Dashboard
This fleet monitoring tool gives you clear utilisation data for your fleet to inform decisions about fleet use and efficiency. It features:
A graph that shows utilisation trends
Statistics for utilisation per vehicle type
Key utilisation statistics such as average utilisation per vehicle, average distance travelled per vehicle, average hours driving per vehicle and average days stationary
Most underutilised locations
Most and least utilised vehicles
Data on vehicles held overnight at an unknown location
Using the Fleet Utilisation System you can...
- Quickly understand how well your fleet is being utilised and where improvements can be made
- Identify locations and vehicles which can be utilised more, and optimise your routes to maximise utilisation
- Identify underutilised fleet vehicles with low mileages which can be removed from your fleet to save money
- Determine if high and low usage vehicles can be swapped to reduce wear and tear, and minimise maintenance costs
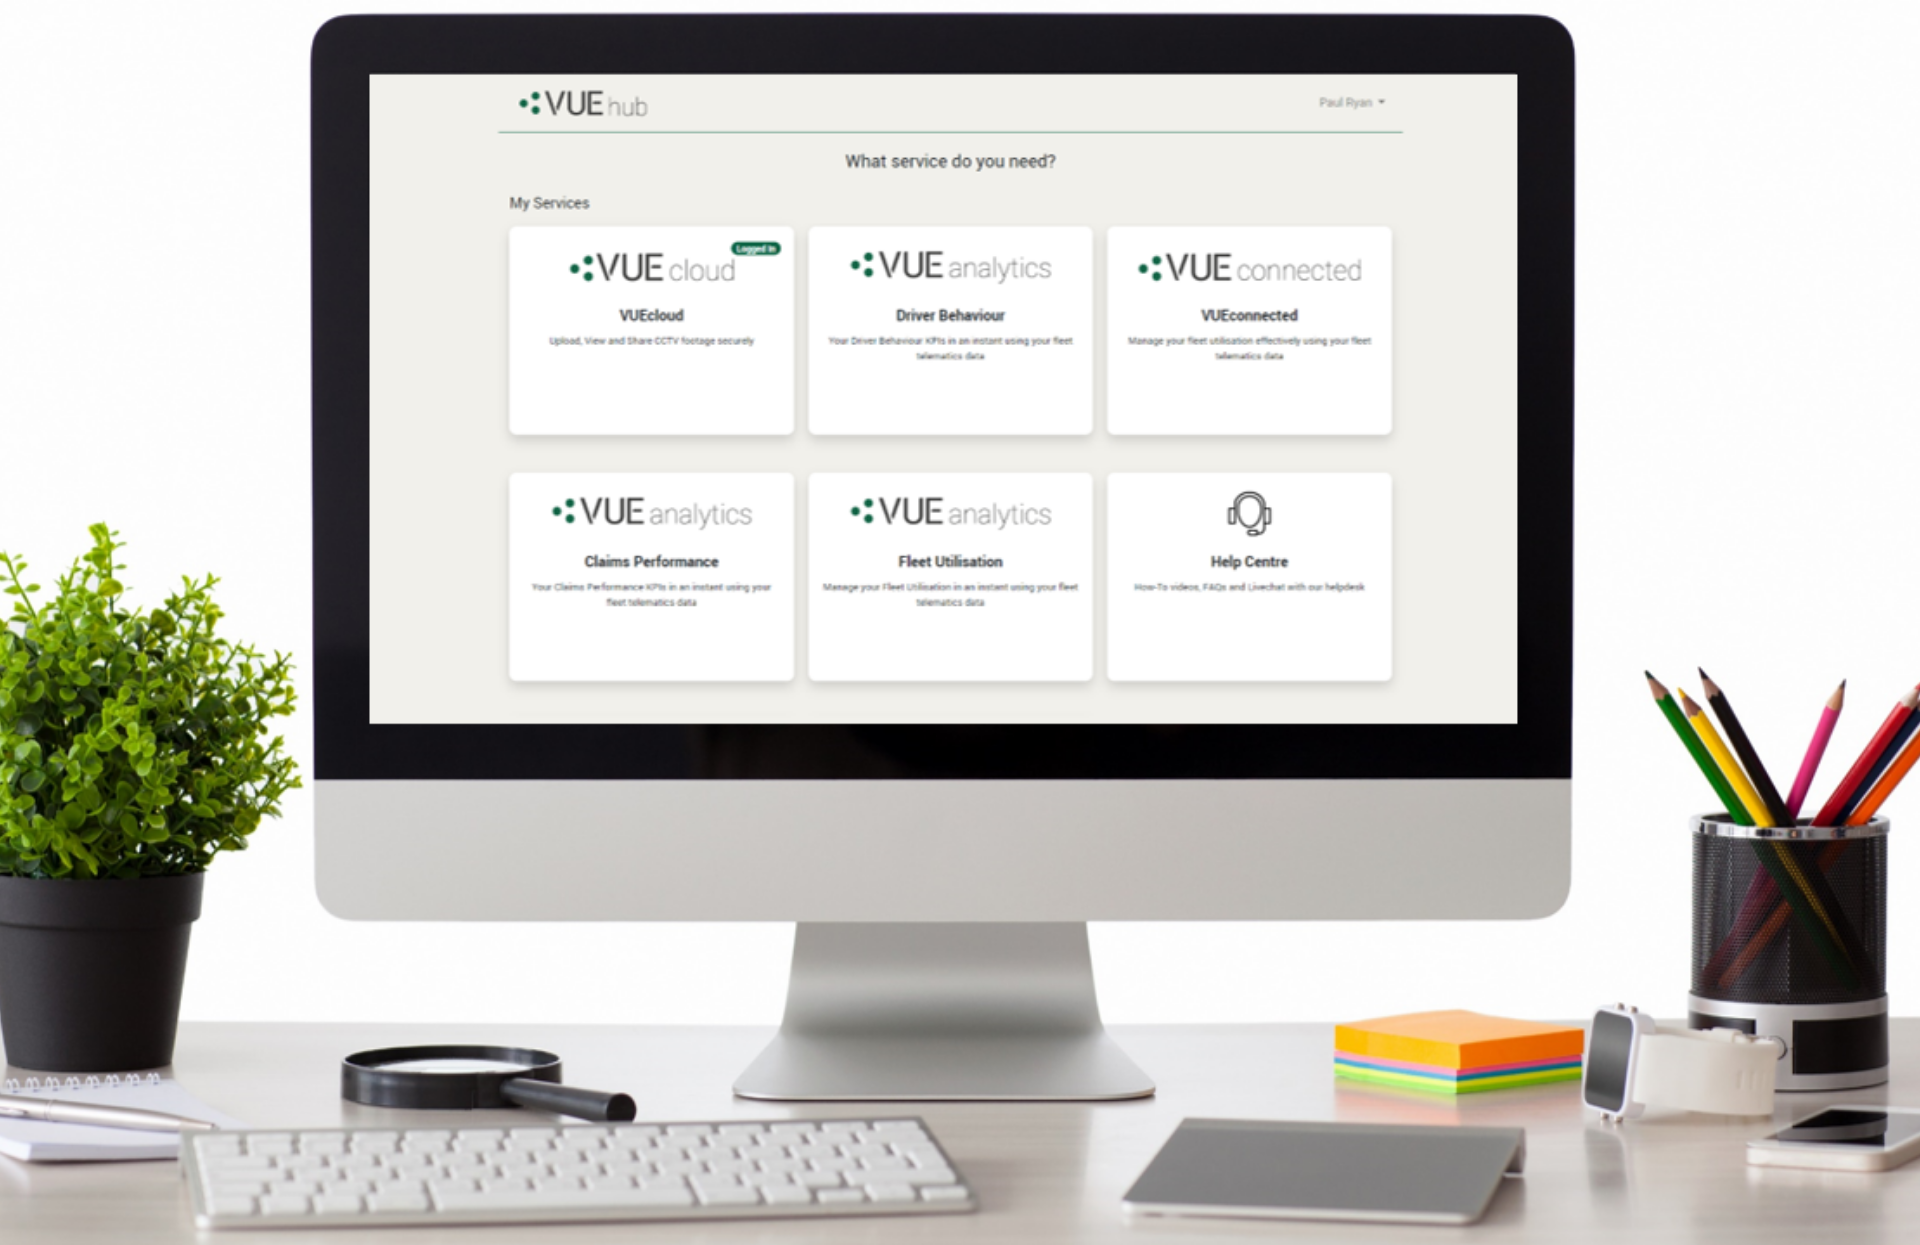

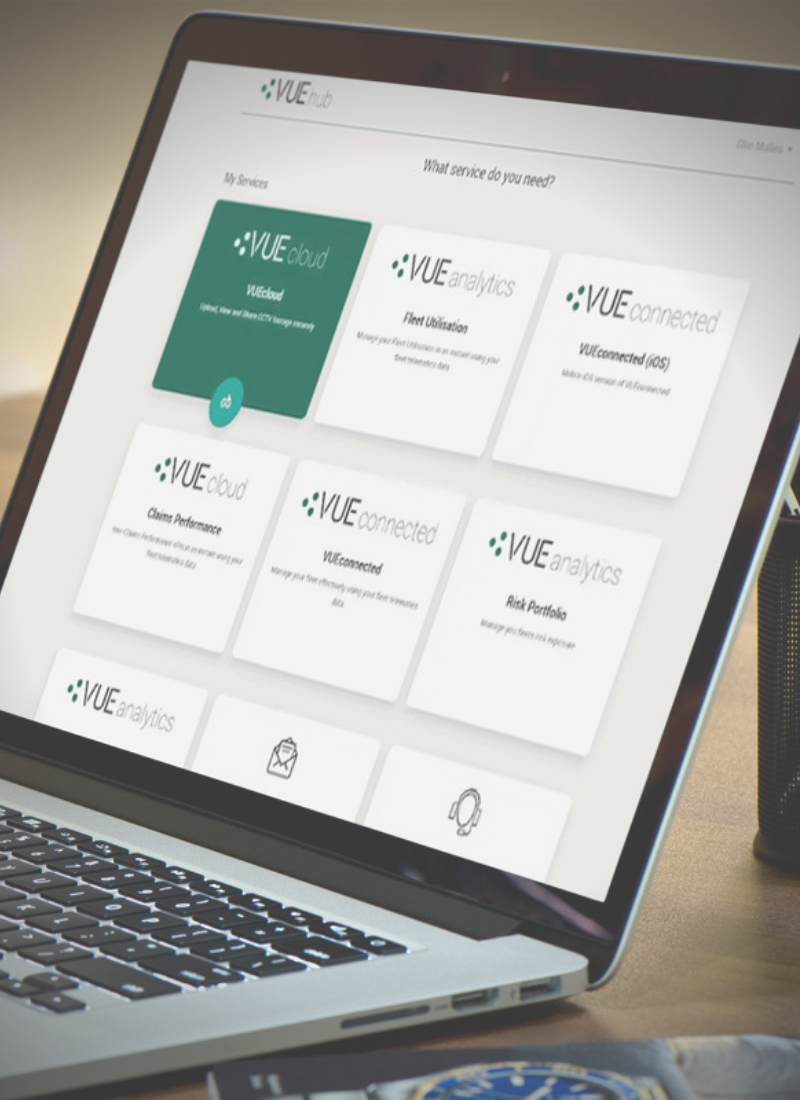
All our software is available in the VUEhub; giving easy access to all our services in one place
The VUEhub is the one place to access all our applications and services with a single sign-on. You can access everything here, from checking live fleet locations, to sharing vehicle footage and analysing data in the Driver Behaviour Dashboard.
To talk about any of our services which provide fleet data and insights.
Latest Case Studies
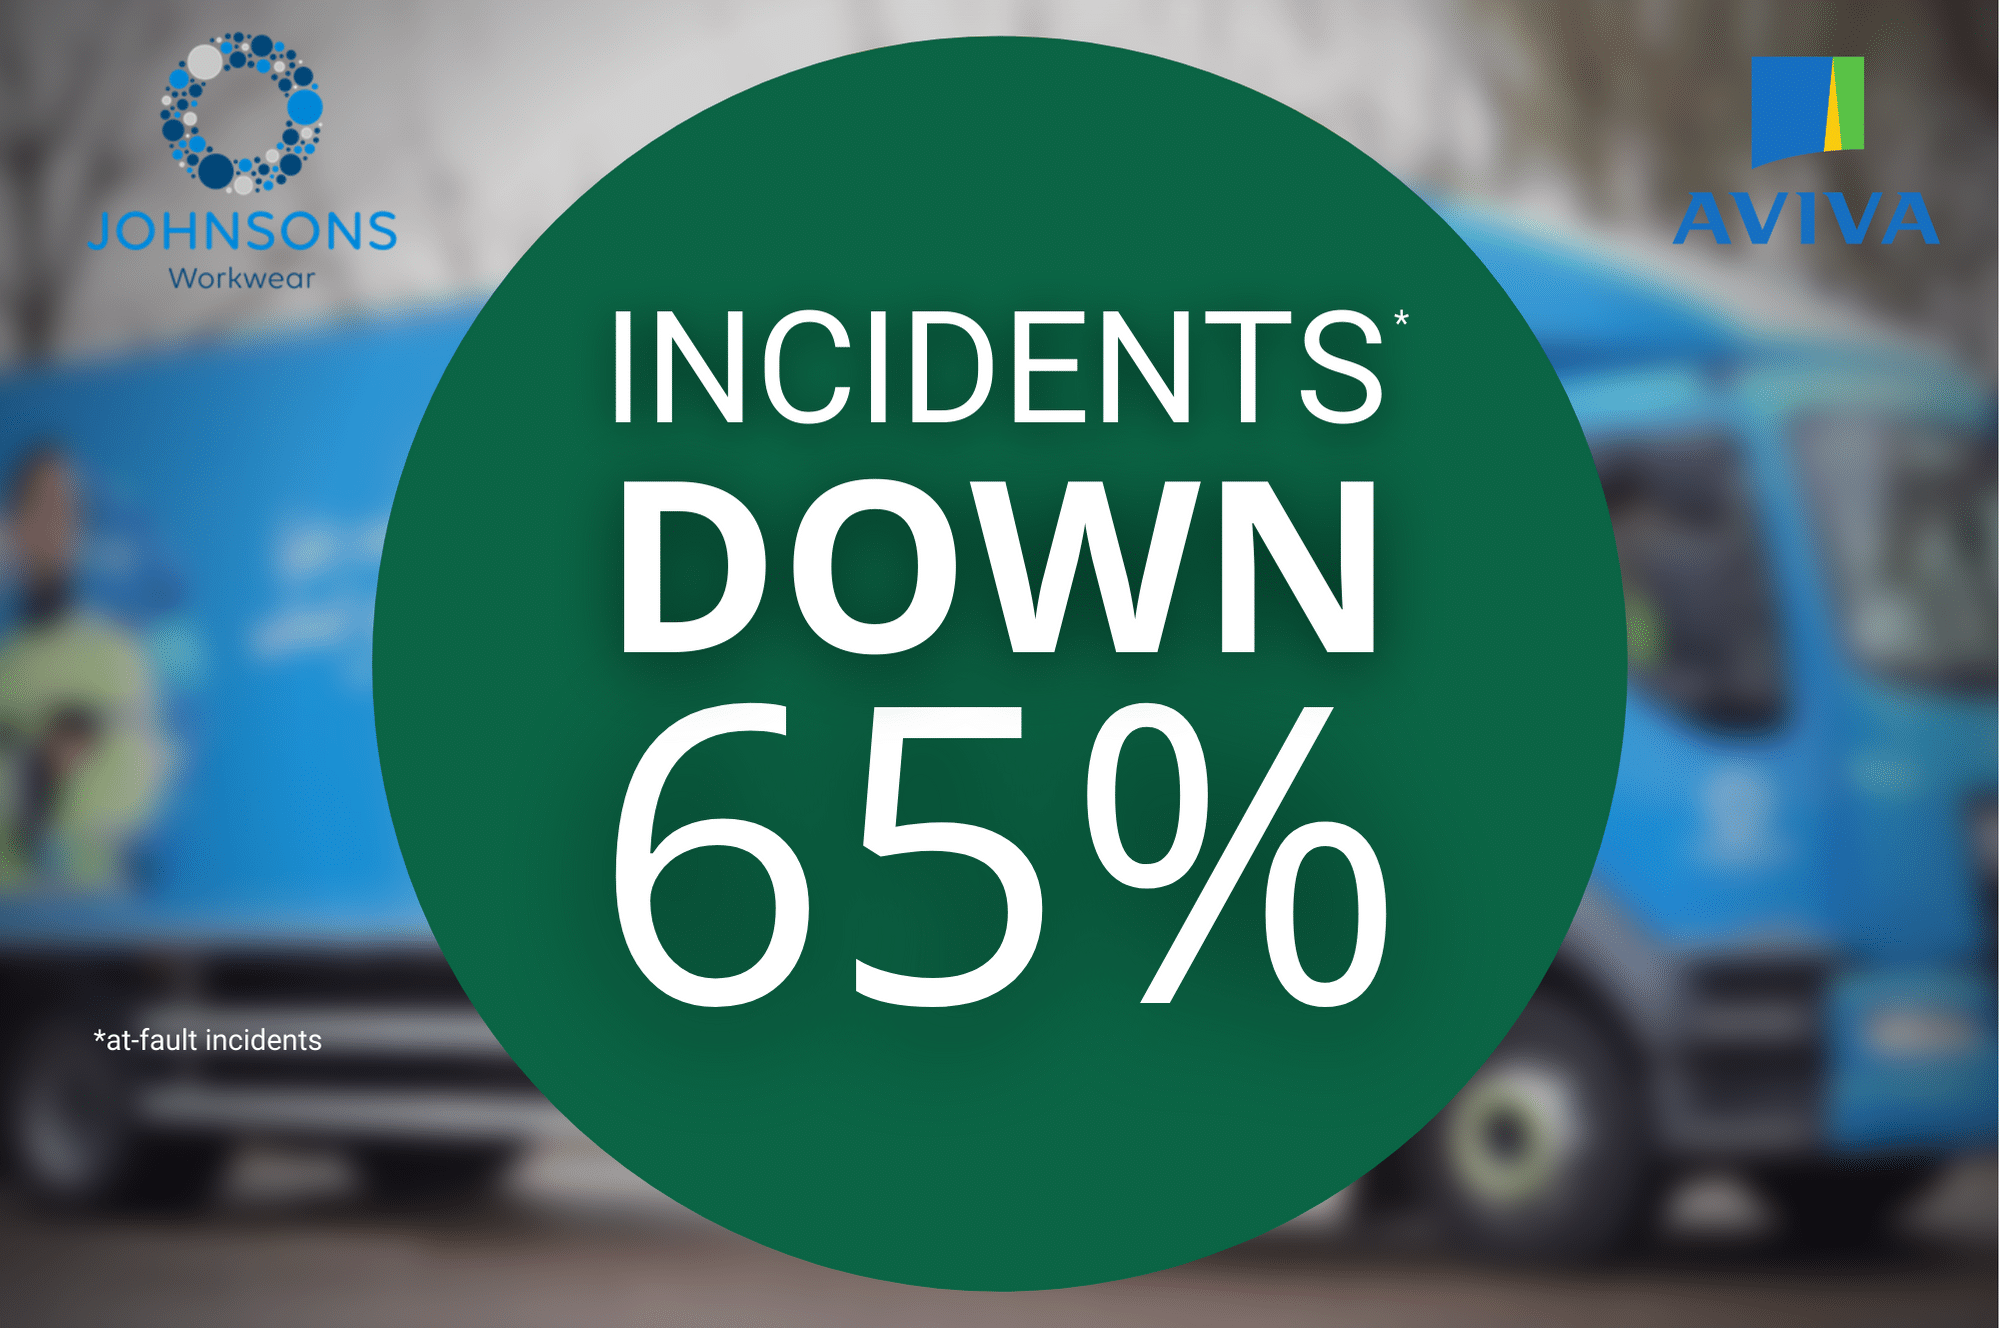
Johnsons Workwear
Discover How Johnsons Workwear Reduced Accident Frequency65% reduction in accident rates in two years
NHS Blood and Transplant
Explore How NHS Blood And Transplant Showed Great Return On Investment65% reduction in accident rates in two years
Total Produce
Learn How Through Using Video Telematics, Total Produce Reduce Incidents And Defend Claims10% reduction in accidents in one year