

VUE is an industry-leading Video Telematics provider with over 20 years’ experience in vehicle video and tracking. Our journey, from our start in 1999 until now, has been shaped by our mission to increase fleet safety. We have fitted countless fleets with Video Telematics and safety equipment which has increased driver safety and reduced incident frequency. We know how devastating road accidents can be, and how many lives it takes and destroys every day. We work with our fleets to understand how these accidents occur and determine how to best prevent them.
That’s why we’ve updated the way we calculate Driver Style Scores on VUEconnected and the VUEdrive App to make them even more accurate. We now weight repeated indications of risky driving when calculating the Driver Style Scores for Acceleration, Braking, Cornering and Speeding to more accurately represent driving behaviour. We also give drivers a Daily VUE Score, a number from one to one hundred, and a VUEstar Rating of one to five stars. This article will give an in-depth explanation of how we calculate these new Driver Style Scores, the Daily VUE Score and VUEstar Ratings. Using these values, fleet managers can better understand the performance of their drivers, reward great drivers and identify areas where their fleet can improve driving to prevent future accidents.
Click here to download our White Paper
The Key Metrics
All of our VUEtech devices (including our VMC range and trackers) have a built-in Global Positioning System (GPS) receiver. These receivers collect and send information about the Velocity, Heading and Timestamps of a vehicle directly to our database. This information is essential to identifying the Driving Style of the vehicle, which we get by calculating these four key metrics: Acceleration, Braking, Cornering and Speeding.
This is how we determine these metrics:
– By combining the Velocity and Time we calculate how quickly the velocity of the vehicle changes, either increasing (Acceleration) or decreasing (Braking).
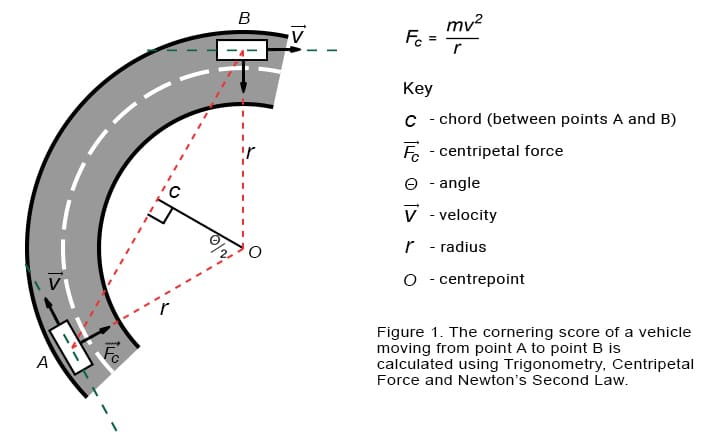
– By combining the Velocity and Heading we calculate the Cornering of the vehicle and can then determine how quickly and dangerously the vehicle has taken a corner or navigated round a bend. (See Figure 1)
– By combining the position of the vehicle, its Velocity and how often the driver exceeds the Speed Limit, we calculate the Speeding.
Figure 1 shows how we calculate cornering and dangerous levels of cornering using trigonometry and the centripetal force:
Calculating The Four Driving Style Scores
In order to represent the Driving Style of each vehicle, we calculate four scores, one for each key metric (Acceleration, Braking, Cornering, Speeding). Our scores range from zero representing the worst possible Driving Style, to 100, representing the best possible Driving Style.
The Acceleration Score represents how often the driver accelerates aggressively. If their score is closer to 100, the driver is more careful with acceleration, but if their score is closer to zero, they are accelerating more aggressively.
The Braking Score is taken from our measure of the deceleration of the vehicle. When the driver brakes in a gentle and controlled manner, their score is closer to 100, but if they regularly brake harshly (i.e. slam on their brakes), their score will be low and closer to zero. This potentially indicates that they are not paying attention to the road or are driving recklessly.
The Cornering Score represents how cautious the driver is when turning a corner or going round a bend. The driver is more cautious when their score is nearer to 100. They are more aggressive and unsafe when their score is nearer to zero, which means they have higher potential to tip over.
The Speeding Score represents how often the driver speeds. The driver doesn’t speed when their score is closer to 100, and speeds excessively and often when their score is closer to zero.
Looking at these Four Driving Style Scores, you can easily understand a driver’s behaviour on the road and determine what actions they can take to improve. For example, look at the cards below:
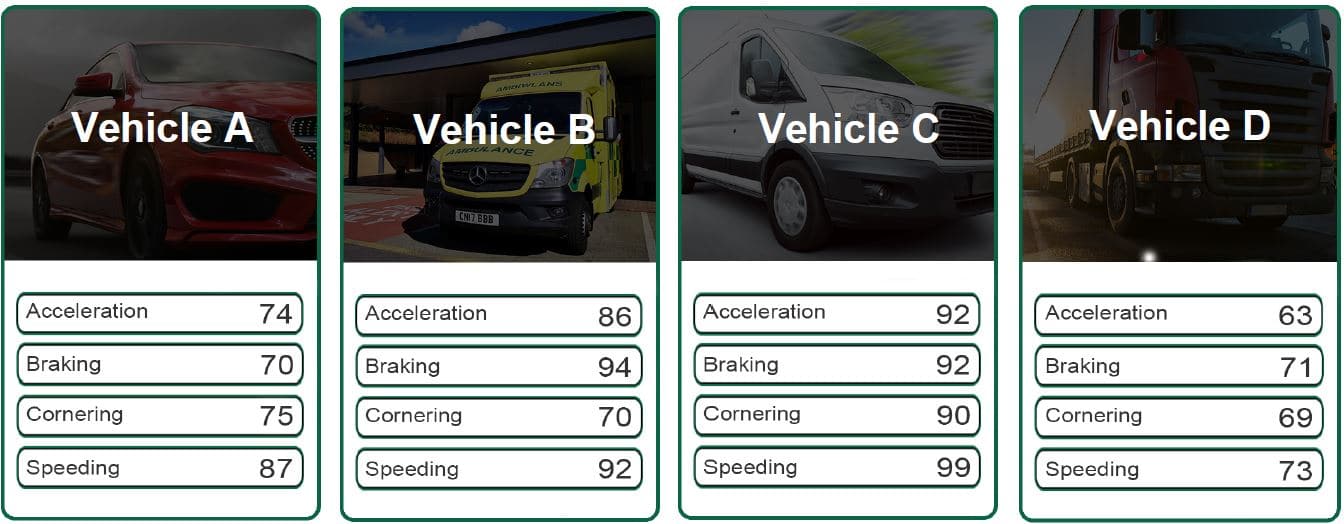
If we look at Vehicle A, we can see that the driver tends to accelerate and brake harshly (Acceleration Score 74 and Braking Score 70), but doesn’t violate the speed limit frequently (Speeding Score 87). They also have a Cornering Score of 75, which means that they should try to reduce their speed when cornering.
You can make similar observations for the drivers in each vehicle based on their Driving Style Scores. You can also compare their scores to determine who has better driving behaviour. With high scores across the board, the driver in Vehicle C is the best driver, whereas the driver in Vehicle D has the worst driving behaviour with the lowest scores.
Finally, one of the most important observations is that, regardless of their scores, all of these drivers can improve their Driving Style. It is completely in their power to take action, drive more safely and earn higher scores on future trips.
Accuracy Of Our Driving Style Scores
Our Data Science and Software Development teams have worked hard to ensure that our new Driving Style Scores are even more accurate and fully representative of every driver’s behaviour and the type of vehicle they drive.
When we calculate the Acceleration Score, for example, we initially identify and calculate every individual acceleration event. When the Change in Velocity (ΔV) of two consecutive observations is positive, the velocity has increased and acceleration has occurred. When we calculate the final Acceleration Score, we only consider the acceleration events that are above a basic threshold. This threshold is a number which represents the difference between acceptable acceleration, such as acceleration after a green light, and unsafe driving.
After that, we weight each acceleration event based on these three factors:
– Difference of each event to the basic threshold.
– The vehicle category (Car, Van, Light Commercial Vehicle [LCV], Heavy Goods Vehicle [HGV], Bus, Plant, Fork Lift Truck, Agricultural Vehicle, Motorcycle, Emergency Services, etc.).
– The consistency of the unsafe acceleration events.
For example:
– A bigger ΔV in a specific period is weighted more than a smaller ΔV in the same time.
– The same ΔV in the same period has different weights for different vehicle categories.
– The more times a vehicle surpasses the basic threshold in a specific route, the higher its acceleration score is weighted.
Regarding our Braking Score, we’d like to make it clear that braking is not only the application of brakes on a vehicle but is any deceleration of the vehicle. A motion is categorised as deceleration when the Change in Velocity (ΔV) of two consecutive observations is negative, meaning that the velocity has decreased. For that reason, the calculation of the Braking Score follows the same process as the Acceleration Score. The final Braking Score takes into account the difference of all braking events to the basic threshold, the vehicle’s category and the consistency of unsafe braking events.
To calculate the Cornering Score, we initially identify every time a vehicle changes heading in its unique route, which is how we personalise the score to the route. Then, we calculate the final Cornering Score by weighting each cornering event based on its difference to the basic threshold of safe driving, the specific vehicle’s category and the consistency of the unsafe cornering events.
To calculate the Speeding Score, we first identify all instances in which the vehicle goes over the Speed Limit. Then, we weight by distance travelled while in the Speed Limit zone and the amount of times each vehicle exceeds the Speed Limit during its journey.
So:
– Driving 5mph above the Speed Limit in a 30mph zone will decrease your Speeding Score more than driving 5mph above the Speed Limit in a 70mph zone.
– 10 instances of speeding in a journey of 10km will have less impact on your Speeding Score than 10 instances of speeding in a 2km journey.
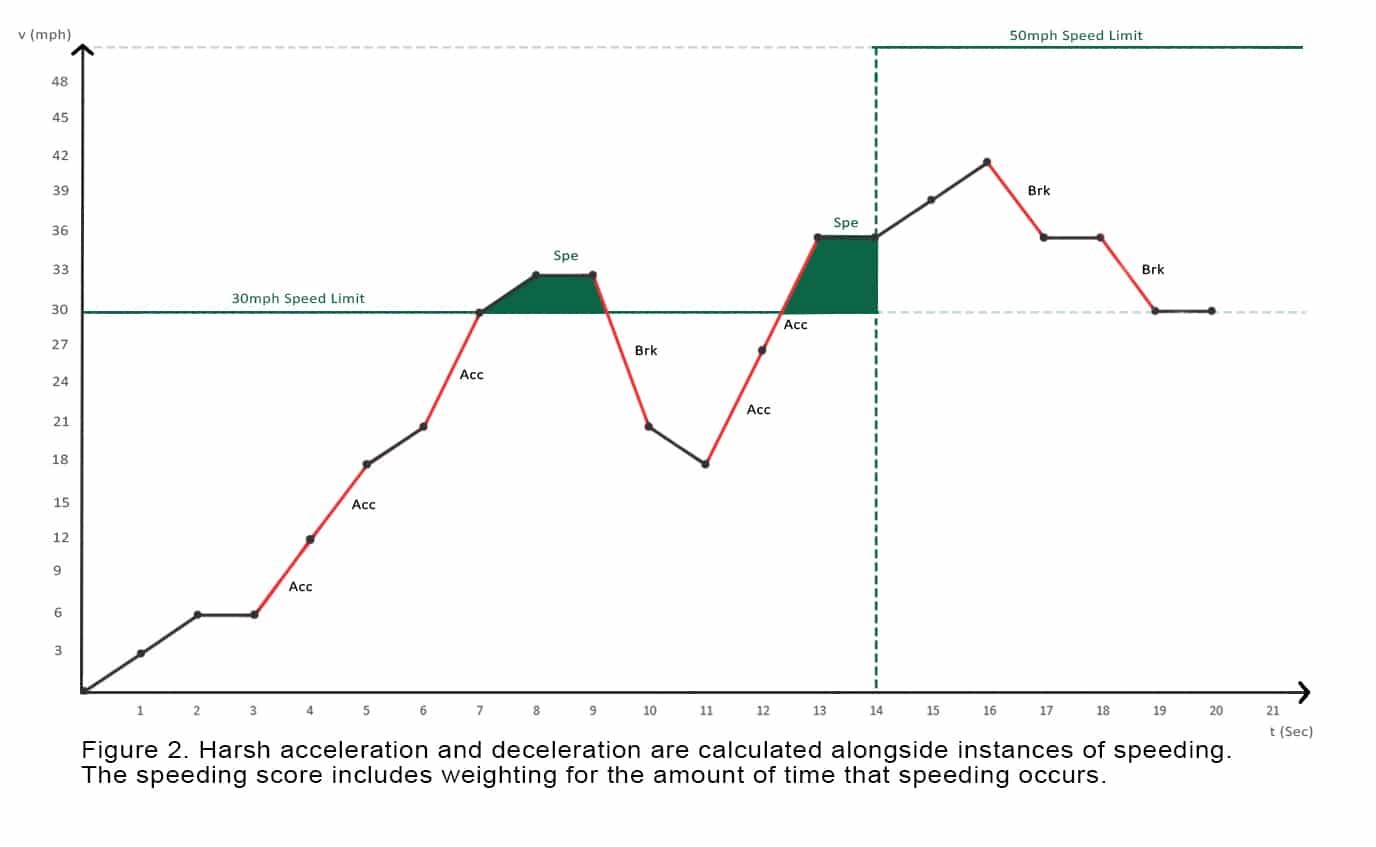
Figure 2 illustrates how harsh acceleration and deceleration is recorded, and instances of speeding:
Daily VUE Score
After calculating scores for the four key metrics, we then calculate their average value (mean), which is called a Daily VUE Score. Drivers can see their Daily VUE Score on the VUEdrive App to get a general sense of how well they performed that day, and fleet managers can see these scores on the Driver League Table in VUEconnected.
To gain a more detailed understanding of driving behaviour, you should look at all of these Driving Style Scores and see how each driver is behaving according to the driving goals of your fleet. Looking at only one key metric or the Daily VUE Score is not enough to gain a detailed picture of driving behaviour. For example, look at the table below:
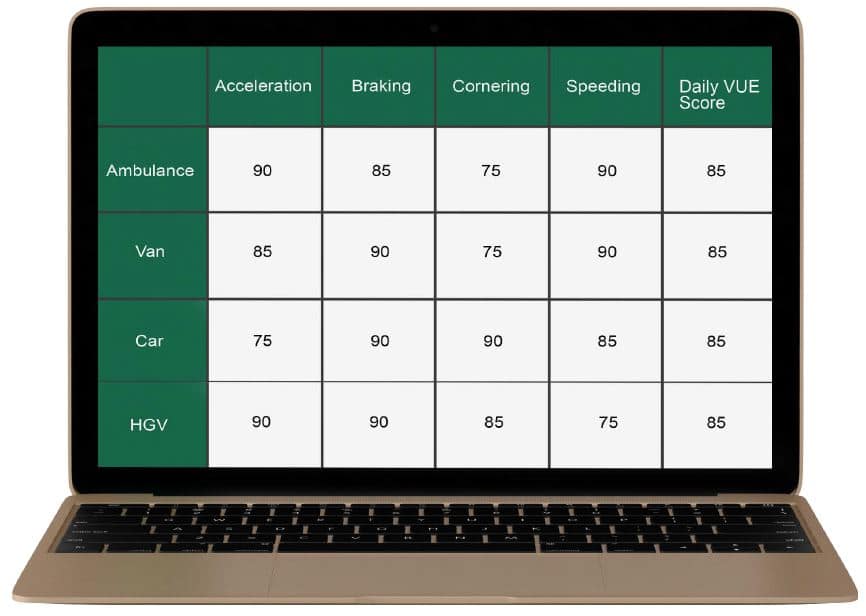
All of these vehicles have the same Daily VUE Score, but in order to rank these drivers you should focus on the goals and priorities of your fleet. This means that:
– If your fleet’s priority is to focus on reducing excessive Acceleration and Braking, which will help lower fuel costs, then the HGV driver has the best Driving Style compared to others.
– However, if your fleet’s priority is to focus on improving Cornering and reducing Speeding, which will help decrease the number of accidents and fines, then the driver in the car has the best Driving Style.
Ultimately, it’s up to each fleet to identify what they’d like to improve on and rank their drivers and scores accordingly.
VUEstars Rating
One more feature that we provide on our platforms is a VUEstars Rating for each vehicle, which is the star rating that drivers see on their VUEdrive App and fleet managers see in VUEconnected. To determine the number of VUEstars, we:
1. Gather all of the Daily VUE Scores on our system for all vehicles
2. Separate these Daily VUE Scores according to their specific vehicle category (such as vans, HGVS, etc.)
3. Assign a VUEstars Rating to each vehicle based on their percentage score in their vehicle category
As an example, let’s look at the table below:
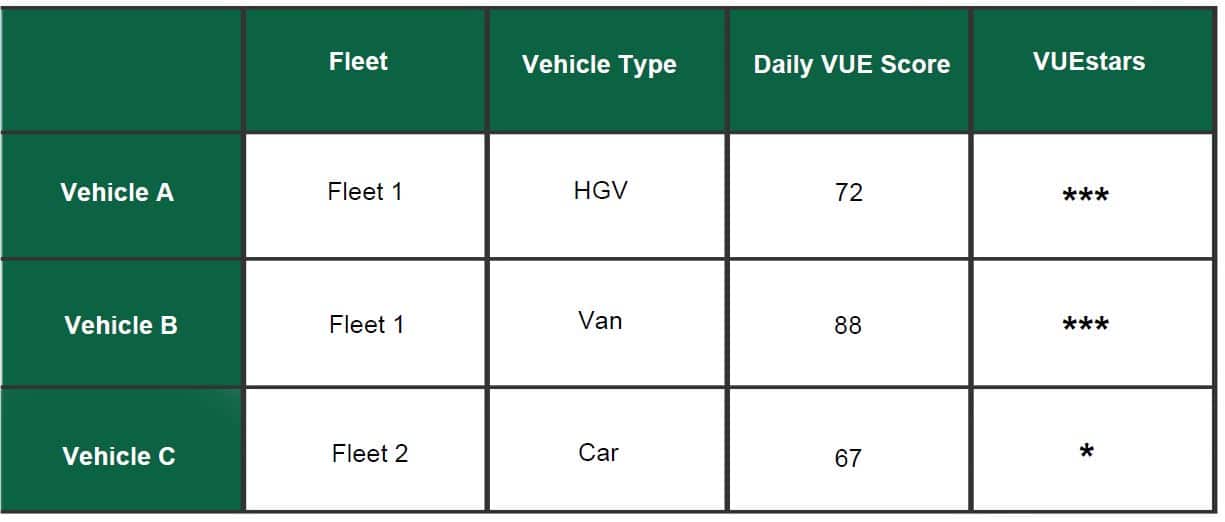
Although Vehicle A has a Daily VUE Score of 72 and Vehicle B has a higher Daily VUE Score of 88, they both have three VUEstars. This is because Vehicle A’s three VUEstars reflects their performance as an HGV compared to all other HGVs. Vehicle B’s three VUEstars reflects their performance as a van compared to all other vans.
On the other hand, Vehicle C’s one VUEstar reflects their poor performance as a car compared to all other cars in the database.
Summary
In summary, our new way of calculating the Driver Style Scores for Acceleration, Braking and Cornering is by weighting three factors: the difference of each event to the basic threshold, the vehicle category and the consistency of unsafe driving events. We’ve updated the way we calculate the Driver Style Score for Speeding by weighting the distance travelled while in the Speed Limit zone and the amount of times each vehicle exceeds the Speed Limit during its journey. We also provide a Daily VUE Score which averages these values to give drivers a general sense of how well they’ve performed that day. Our VUEstars Rating is also valuable to look at, as it tells drivers how well they’ve performed compared to the population of their vehicle category (such as HGVs, LCVs, etc.) by giving them one to five stars.
To gain a detailed understanding of driving behaviour, it’s good to look at all of these values instead of just one. Fleet managers should rank drivers in their fleet according to fleet goals (such as improving Cornering or reducing aggressive Acceleration) and can easily identify areas of improvement for their entire fleet. They can then put measures in place, such as additional training and reward programmes, to improve driving behaviour across the board and reduce the number of accidents on the road.
Our team never forgets that behind every score and data point is not just a vehicle but a human, a family. We’re immensely proud that we help fleets improve driving behaviour so that their drivers, and everyone else on the road, can get home safely at the end of the day.
We hope your enjoyed our article on how we calculate the Driver Style Scores on VUEconnected and the VUEdrive App. If you’d like to contact us then please call 0161 877 2257 or email us at info@vue-cctv.co.uk.