
VUE’s vehicle CCTV and video telematics have been helping Vans for Band to maintain its high brand reputation and reduce vehicle damage.
Read More
An individual fleet risk management tool, the Driver Behaviour Dashboard displays advanced telematics and claims data in context to help users understand the specific factors that affects Driver Behaviour and determine the likelihood of accidents.
The Driver Behaviour Dashboard works with any telematics data provider and can be customised to suit your exact requirements
Arrange a Free DemoSee charts with a colour-coded design which indicate how well your fleet is performing over a period of time, allowing you to efficiently find areas for improvement
View a breakdown of your overall fleet health including an average fleet score for speeding, idling, braking, acceleration, cornering, as well as an overall score
Analyse key fleet statistics including average miles per gallon (MPG), average miles driven per week, total number of claims and claim costs
See scores for your individual drivers based on their speeding, idling, harsh cornering and harsh acceleration, and sort your top and bottom drivers easily
Explore how your drivers have improved week-by-week, so you can monitor progress closely
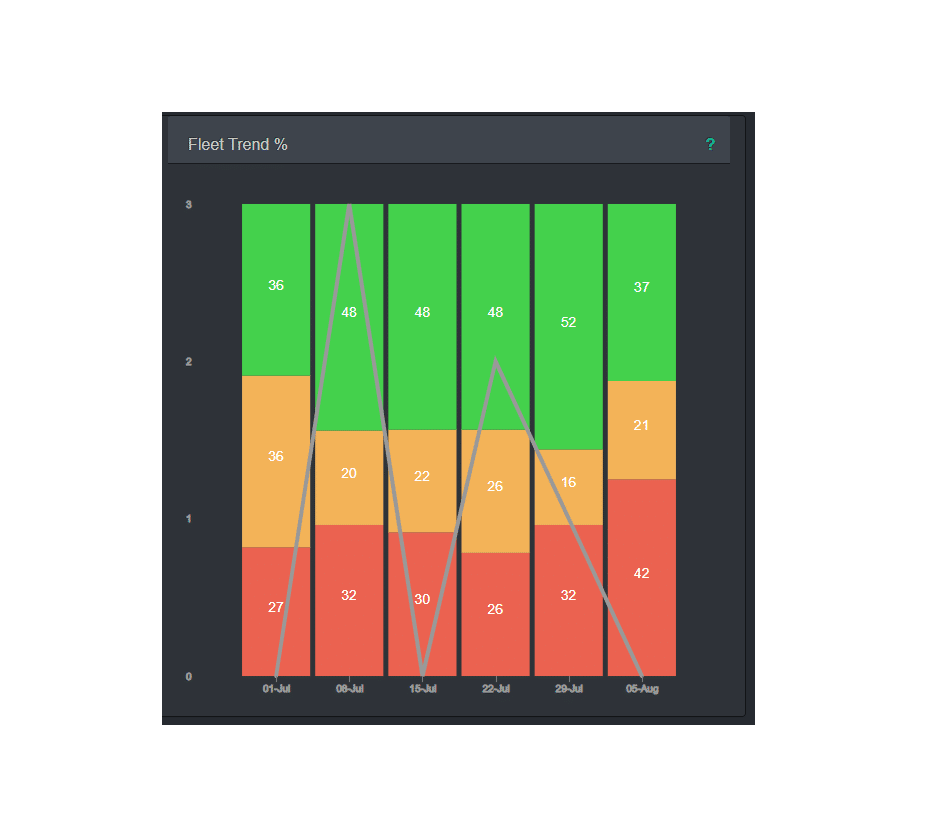
See how your fleet is performing over a period of time. The Red, Amber, Green design allows you to quickly identify areas that need improvement.
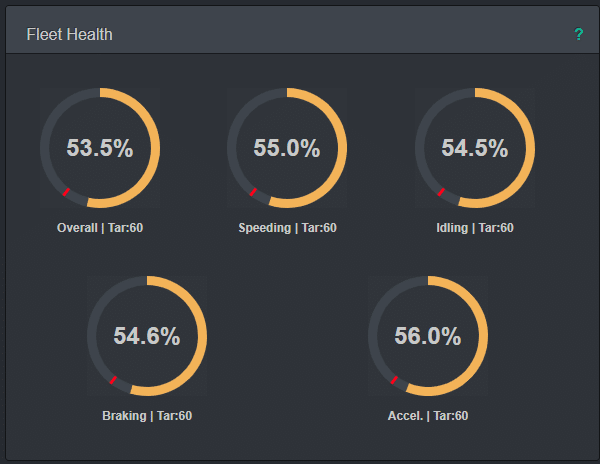
See how your overall fleet is performing against targets you set. This can help identify drivers who need additional training.

Quickly see who your best performing drivers are and how they compare to other drivers. Reward great behaviour and encourage improvement in those who need it.
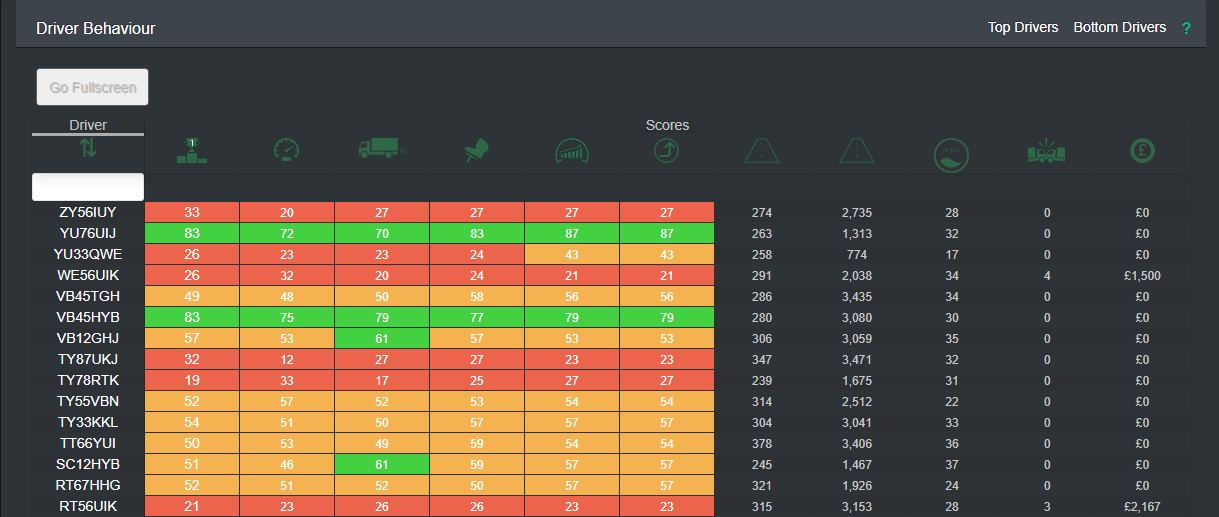
Easily see your worst performing drivers. This can help you identify areas of driver training and development
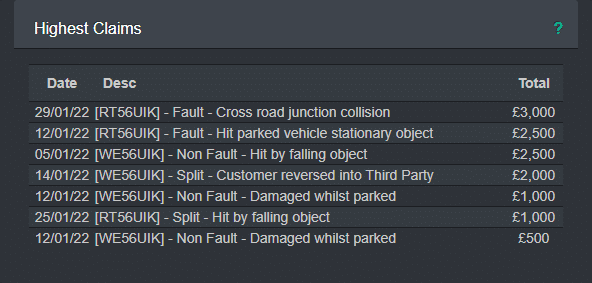
By integrating your claims data with VUEanalytics you can see which drivers have the most claims and those with the highest cost of claims.
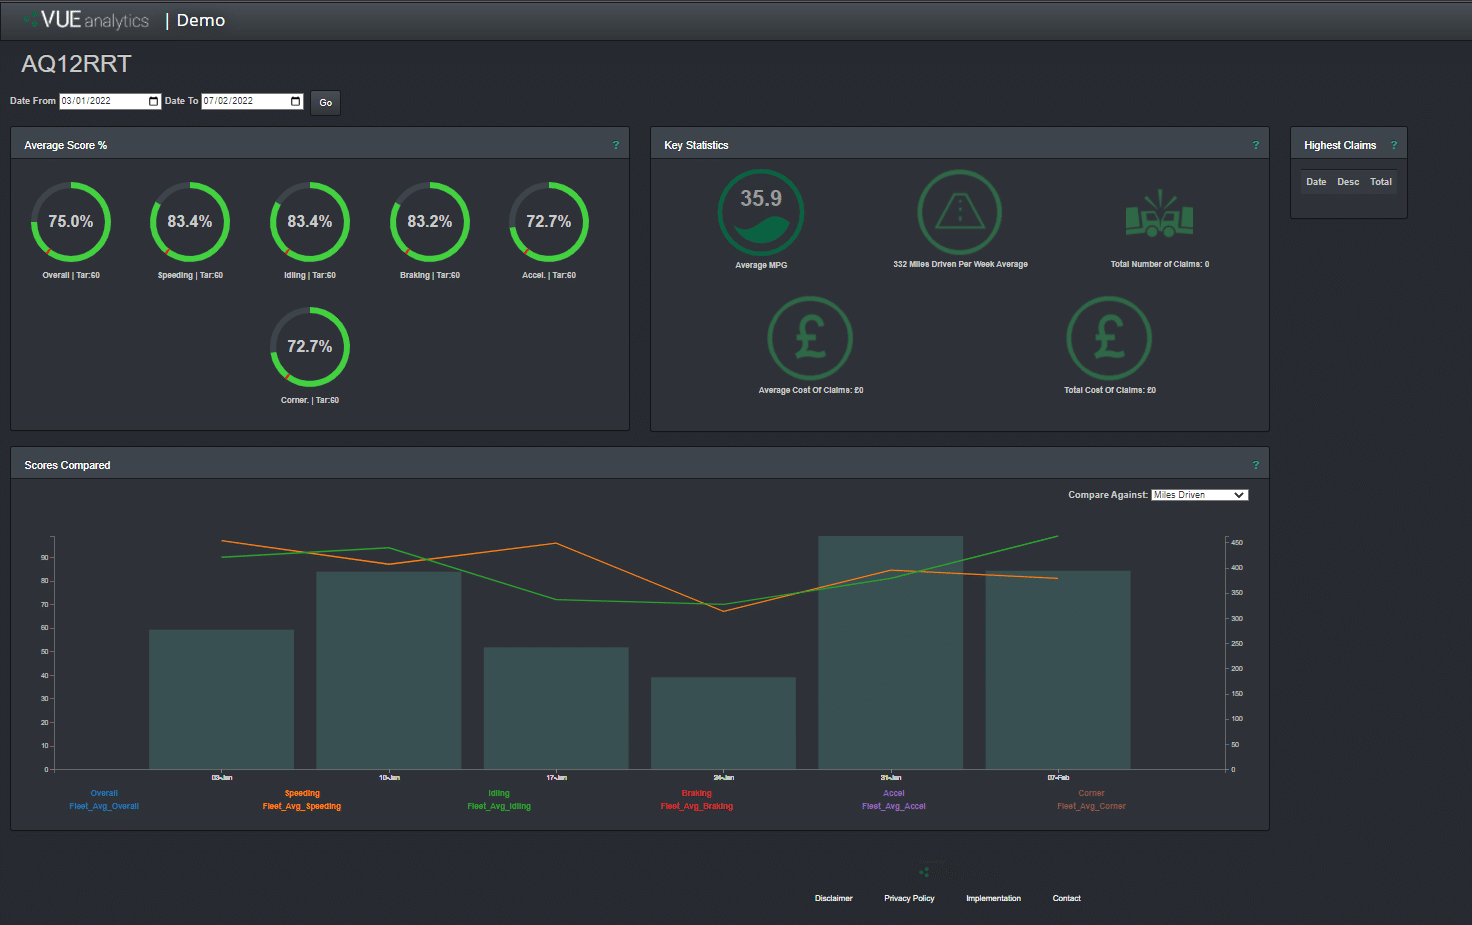
Deep dive into individual drivers and see how their performance compares to your other drivers as well as industry standards.

VUE’s vehicle CCTV and video telematics have been helping Vans for Band to maintain its high brand reputation and reduce vehicle damage.
Read More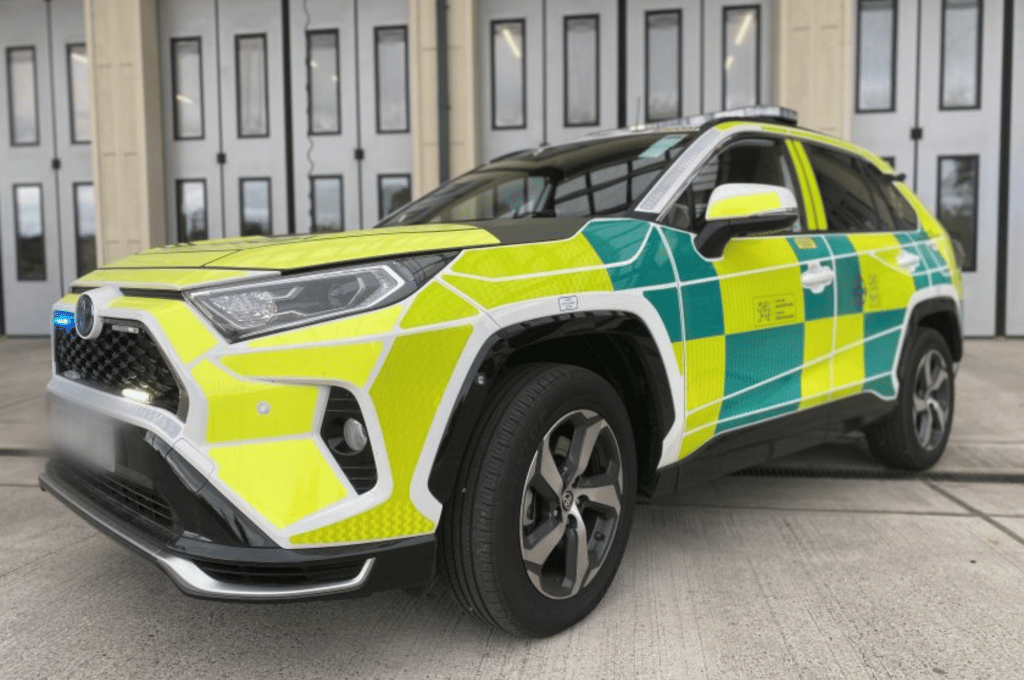
In January 2022 Welsh Ambulance Service (WAST) came to VUE Group, the Salford-Quays based Video Telematics company, with a list of specific CCTV and telematics requirements...
Read More
VUE are delighted to announce a successful trial of the Low Bridge Alerting System with XPO Logistics, a leading provider of freight transportation services.
Read More